Housing + Transportation

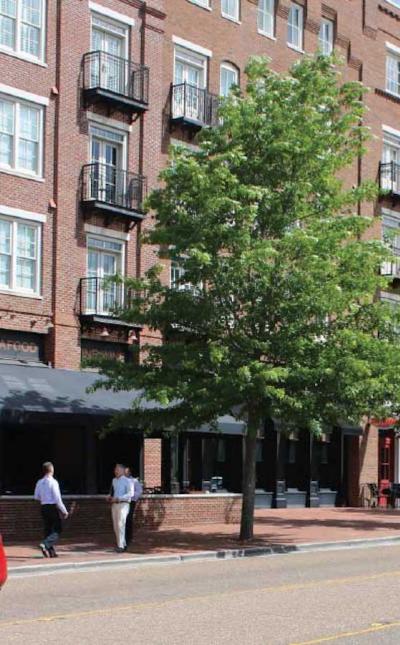
  • Historic arcade houses young professionals
    <strong>Microlofts at The Arcade Providence</strong>&nbsp;<em>Providence, Rhode Island</em>

    Build Great Places / #thisiscnu

  • Mercado District | Tucson, Arizona
    A timeless place from the ground up. #thisiscnu

    Build Great Places / #thisiscnu

  • Crosstown_Concourse_2018_Charter_LooneyRicksKiss
    Crosstown_Concourse_2018_Charter_LooneyRicksKiss
    From former warehouse to "vertical village"
    <strong>Crosstown Concourse</strong>&nbsp; <em>Memphis, Tennessee</em>

    Build Great Places / #thisiscnu

  • Southside
    Ten acres that transformed a city #thisiscnu

    Build Great Places / #thisiscnu

  • A unique building becomes a hub for historic neighborhoods
    <strong>Ponce City Market</strong> <em>Atlanta, GA</em>

    Build Great Places / #thisiscnu

  • Jazz Market New Orleans Audience Seating
    Jazz Market New Orleans Audience Seating
    Trumpeting a cultural revival
    <strong>Peoples Health New Orleans Jazz Market</strong>&nbsp; <em>New Orleans, Louisiana</em>

    Build Great Places / #thisiscnu

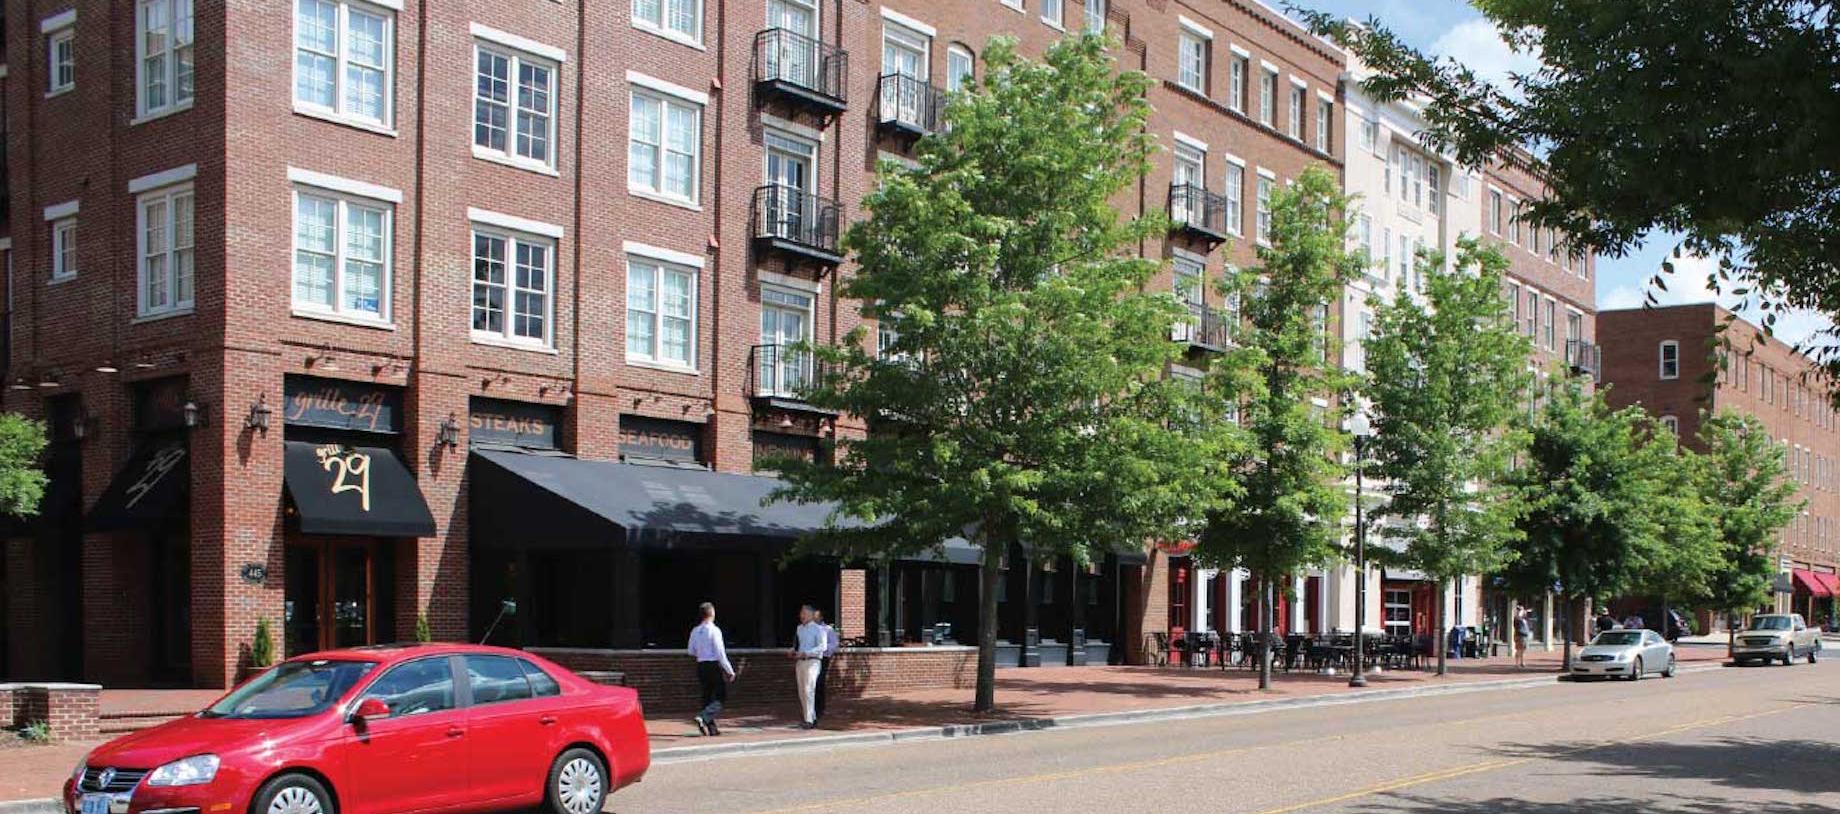
  • Expanding options for a car-oriented suburban area
    <strong>Village of Providence</strong> <em>Huntsville, AL</em>

    Build Great Places / #thisiscnu

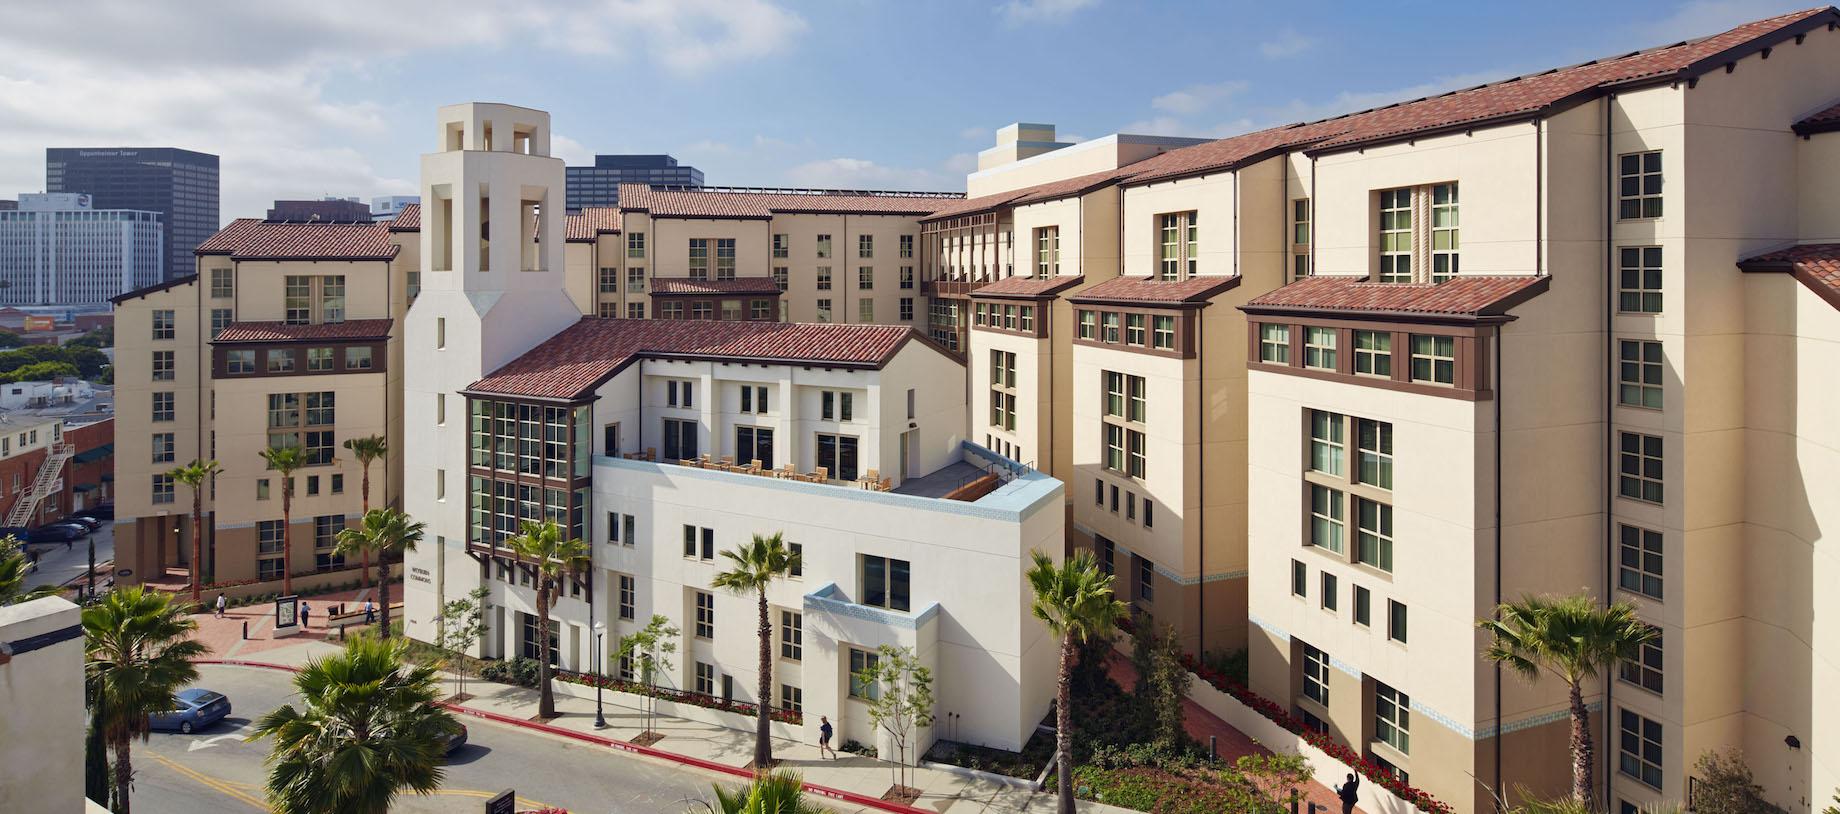
  • From parking lot to urban tour-de-force
    <strong>UCLA Weyburn</strong>&nbsp;<em>Los Angeles, California</em>

    Build Great Places / #thisiscnu

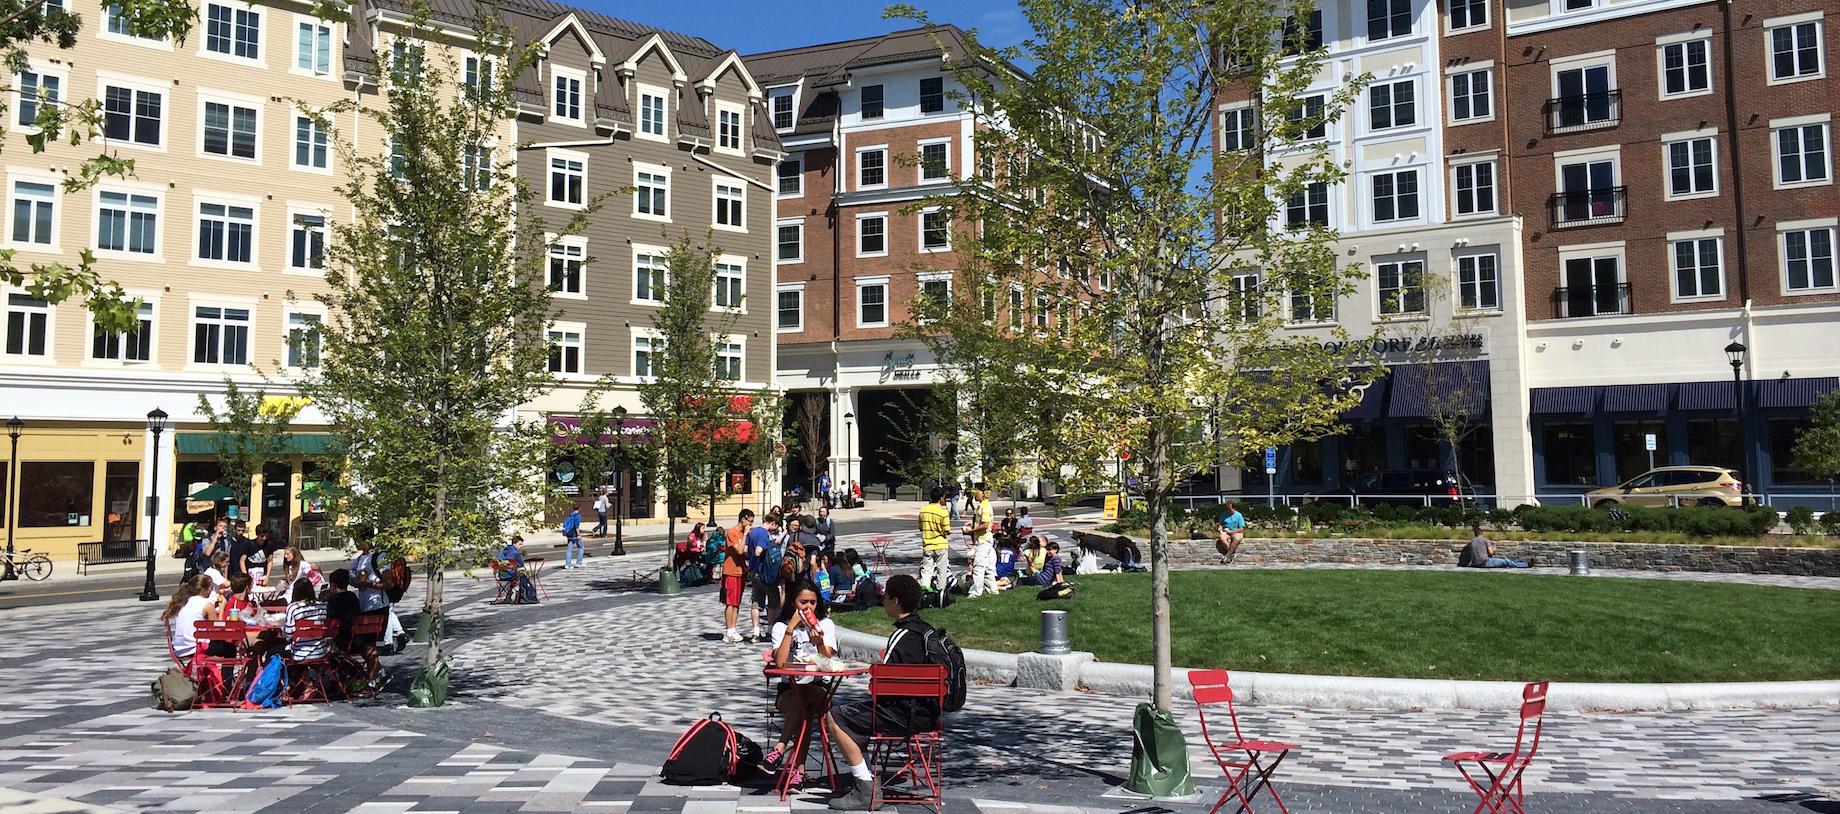
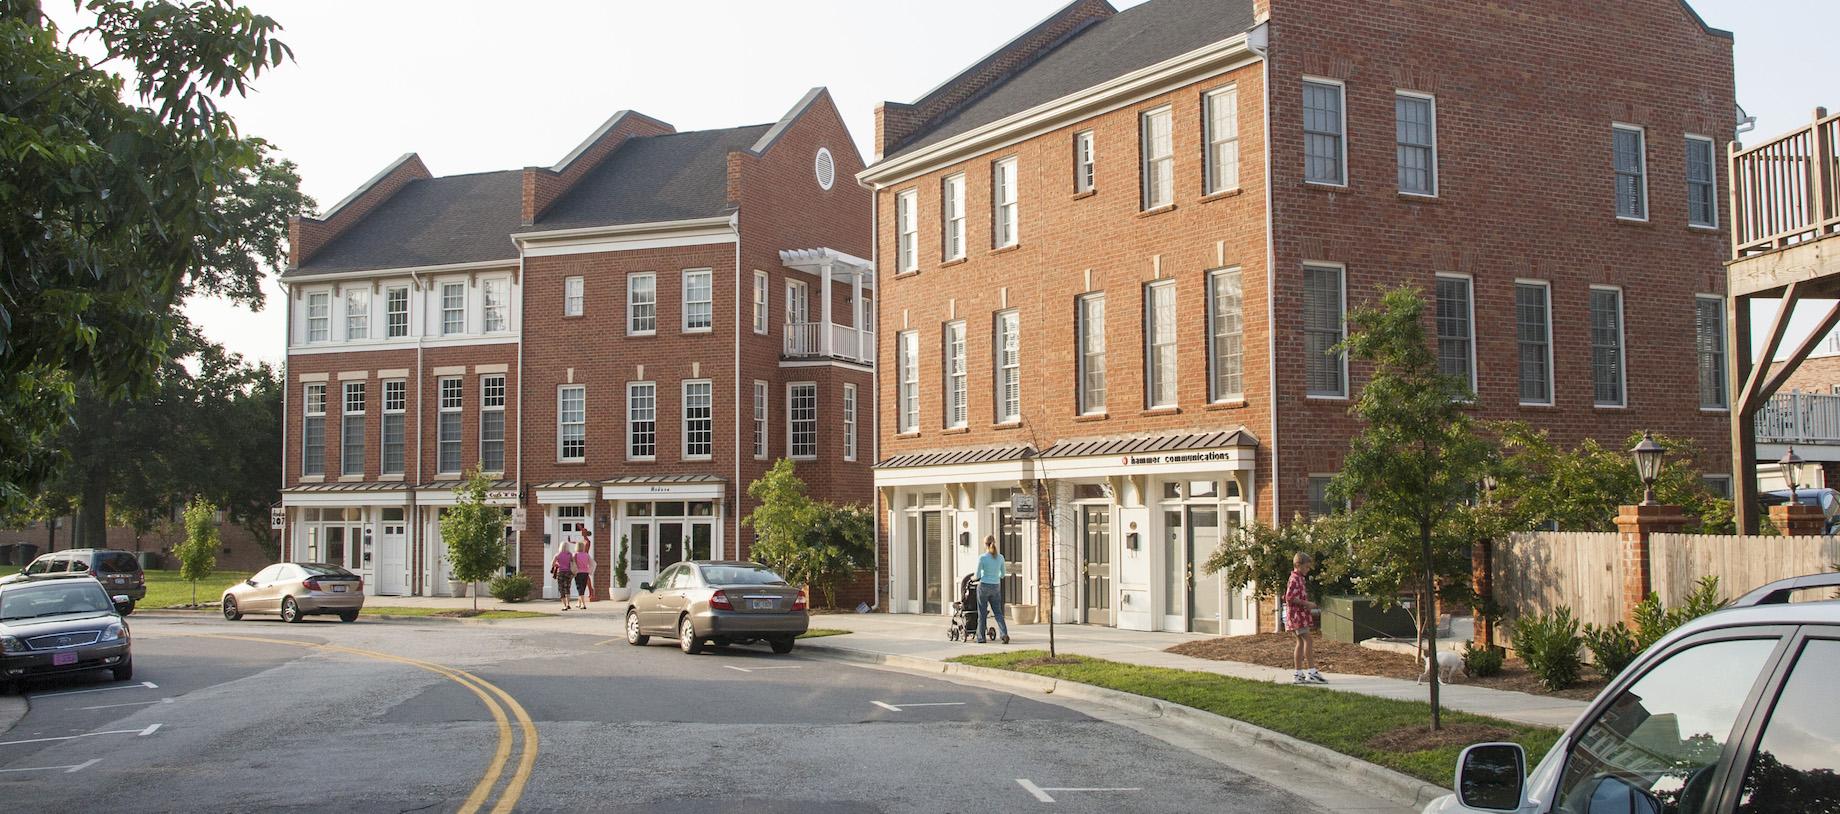
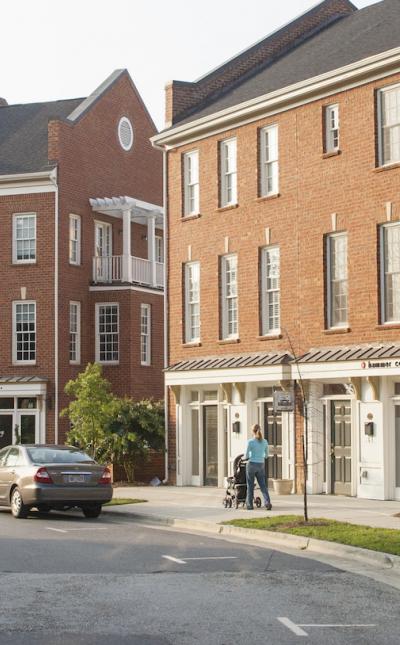
  • A mixed-use center for town and gown
    <strong>Storrs Center</strong> <em>Mansfield, CT</em>

    Build Great Places / #thisiscnu

For many American households, spending on housing is eclipsed by the costs of daily transportation—especially in driveable suburbs, where auto maintenance and gas prices are a major budget concern. Communities seeking to cultivate affordable neighborhoods should consider both sets of costs as part of the same puzzle: balancing housing and transportation costs.

The Center for Neighborhood Technology, a partner of CNU, developed the H+T Affordability Index, which measures true neighborhood affordability by taking into account transportation costs.  The H+T Index quantifies affordability in nearly 200,000 neighborhoods across the US by taking into account the combined costs of housing and transportation —providing a more complete picture of residents’ household spending.

When the H+T Index is used to compare neighborhoods, the difference can be dramatic. For example, in Grand Rapids, Michigan, combined housing and transportation spending in “location-efficient” neighborhoods, mostly walkable suburbs near downtown, amounts to 45% of household income. In less location-efficient neighborhoods further from walkable areas, combined spending averages 59.27%.

By measuring key aspects of the built environment like block size, density, and transit, and economic indicators like job access and income, the H+T Index allows citizens, planners and public officials to understand what makes places location-efficient—and see the full picture of how transportation costs impact affordability for residents.